
Since your website is the hub of your online presence, you want to ensure it’s responding to the needs of your customers. One way to assess its effectiveness is by examining your website traffic. Website analytics provide real data on the volume of visitors to your site, where they’re from geographically, what content they’re looking at, how long they spend, whether they’re first-time or repeat visitors, and more. Google Analytics is a free metrics program which provides detailed and actionable information.
Today’s post will focus on bounce rate, one of the key metrics available in Google Analytics. Your website bounce rate is the percent of visitors who visited your site, looked at a single page, and clicked away within five seconds. While there are cases where such a short visit is acceptable (such as a visitor simply seeking your phone number), typically a high bounce rate is undesirable. Your goal should be to reduce it over time.
When assessing your site’s bounce rate, start with the big picture: your site as a whole. Like any average, it’s a combination of highs and lows.
Begin by reviewing the Behavior menu in Google Analytics. The Overview shows data for your entire site, including the bounce rate as well as other key information such as total page views and average visit duration. Now let’s look deeper.
How are your individual pages performing?
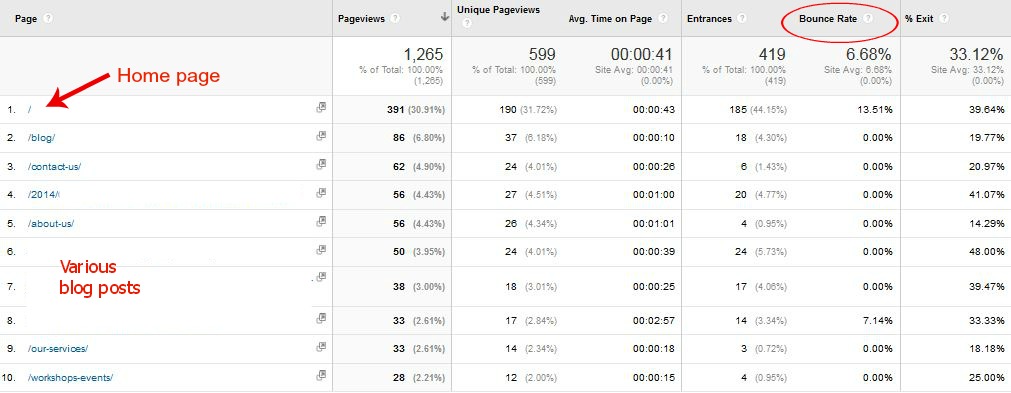
Assuming you have more than a single page website, you’ll want to consider individual pages of your site as well. On the lower part of the Behavior Overview page, you’ll see which pages of your site are holding the attention of your visitors. The overview data is presented with the most popular pages first (based on visits, or sessions). Within the top few pages, you’ll probably see a “/” — which indicates your home page. If you’re blogging effectively, you should see also visits to blog posts in your results.
Further down within the Behavior menu, in the All Pages section under Site Content, you’ll find details of page-specific data. Perhaps you’ll see that your overall site bounce rate of 48% is made up of <5% on most pages and 98% on one page. Clearly, the page with the 98% bounce rate merits a review to determine why visitors are clicking away from it.
The screen shot below shows a site with an overall bounce rate of 6.68%, with individual page bounce rates varying from 0% to 13.51%.
Which channels send the most engagement to your site?
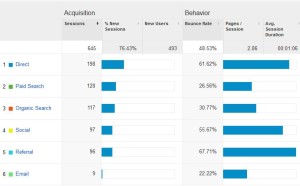
Visitors to your site come from various categories, known in Google Analytics as acquisition segments. The Acquisition category breaks down your site traffic by acquisition segments. Data is provided for organic and paid search, referrals, email and social channels. Compare the bounce rate for each segment of visitors. You’ll note in the screen shot below that while the average site bounce rate is 48%, the bounce rate for visitors from email is only 22% while the bounce rate for referrals is 67%. This data can be used to inform your marketing choices.
 Which platforms and sites are driving website traffic?

Beyond acquisition segments, you can drill down further on your traffic sources by selecting “All Traffic” under the Acquisition menu. In this view, you’ll see bounce rate along with other key metrics including number of visits, visit duration and pages/session for referring each site. In this view you can assess specific marketing strategies, such as Facebook, Twitter, email marketing and LinkedIn.
In the screen shot below, you’ll note that while the bounce rate for the entire site is 48% (indicated in red), visitors from the July 23 email bounced only 12% of the time while visitors from LinkedIn bounced 75% of the time (blue circles).
Does the high bounce rate from LinkedIn mean you shouldn’t be spending your marketing resources there? Actually, not necessarily. As you can see in the screen shot, despite the 75% bounce rate, the eight referrals from LinkedIn spent an average of nearly four minutes (3:55) on your site. In contrast, while only one of the eight visitors from the July 23 email bounced (12.5%), as a group they spent only 38 seconds on your site.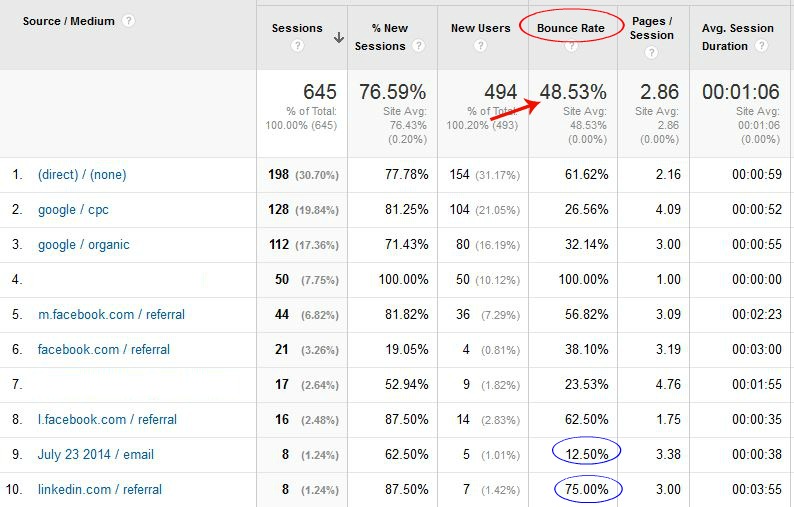
The bounce rate should be considered along with the other metrics in Google Analytics, such as pages/session and duration, to refine your marketing efforts and ensure you are spending time and resources effectively.
If you’d like to learn more, read more of our marketing analytics posts or contact us for one-on-one coaching.