Today’s post is another in our “Tidbits of Wisdom” series. These posts offer knowledge and guidance in consumable, bite-size portions, enabling you to read, process, understand and actualize the learning without taking a lot of time out of your schedule.
We’ve written before about Google Analytics. Installed in the back end of your website, it provides a wealth of information about who’s visiting your site, where they are from , which content they’re looking at, how long they spend, whether it’s their first visit, and much more. It’s a goldmine of information and marketing insights; if you don’t have it on your site yet, make it a priority. (Hubspot offers step-by-step instructions with screen shots.
Today’s post drills down on your content, found in Google Analytics under the menu item Behavior. This data is useful for many reasons. Perhaps you’re creating new website content (such as blog posts, a new service, or updates to your Home page). Wouldn’t it make sense to cater your content to the interests of your website visitors?
Let’s use an example. Say you’re in the elder care industry and you’ve decided to start a blog. Since you know your audience and your market, you probably have some ideas about topics to write about that will be relevant to your potential client. But wouldn’t it be helpful to know the number of visitors who viewed your website content about dementia, Parkinson’s, and mobility issues such as arthritis? Or that the visitors to your dementia landing page spent on average an additional two minutes on your website, exploring your FAQ, services, and resources about Alzheimer’s and dementia? That on average, these visitors explored over four pages, compared with the average visit of two pages?
 Visitor Behavior
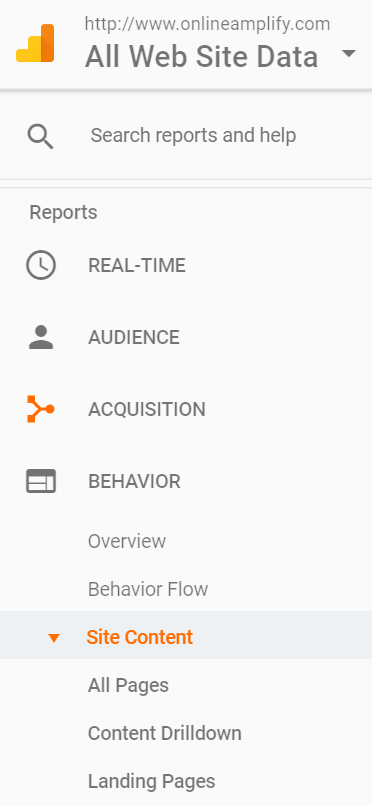
In the Google Analytics navigation menu (placed vertically in the left margin), scroll down to the section called Behavior.
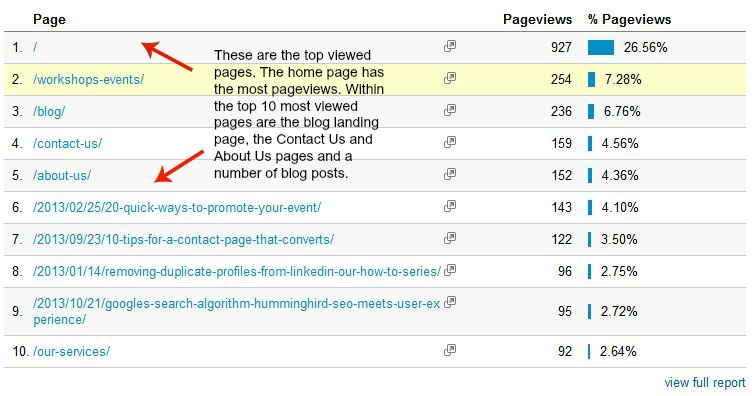
Within the Behavior menu, the Overview shows a high-level view of your visitor data for the time period specified, including a chart and a snapshot of total page views, average time on site, and bounce rate. In the lower right section of the page is a table showing your top viewed pages (also viewable on the sub-page called Site Content).
More than likely, the first entry (your top viewed page) shows a simple slash symbol (/) – that’s your Home page. Listed beneath, by number of visits, are the most visited pages in the time period specified. (Note that if you have more than 10 pages, there’s a “View full report” link to see more, but that’s a topic for another day.)
 Any entry on the table can be clicked on to see data in more depth, including page views, bounce rate, how long the average visitor spent on the page, and the numbers of viewers who started with and ended with the page.
We’ll explore the other pages in the Behavior navigation in future posts. But if you’re craving more than a tidbit of wisdom today, two of the key pages are:
- Behavior Flow: A visual display of the series of pages a visitor viewed, including the number of visits and drop-offs at each page in the series.
- Content Drilldown: Shows data on each page visited, including duration, bounce rate and % exit (the percent of visitors who left your site from this page).
Take some time to poke around in your analytics at your visitor behavior data and let us know your questions.