As a business owner or leader, there are always more tasks to complete than time to handle them. Can you imagine the power of knowing which marketing efforts are driving traffic to your website? Would you be less frustrated with posting on Facebook if you knew it was sending visitors every week? Might you be more motivated to publish your blog routinely if you could see a huge spike in website traffic every time you published?
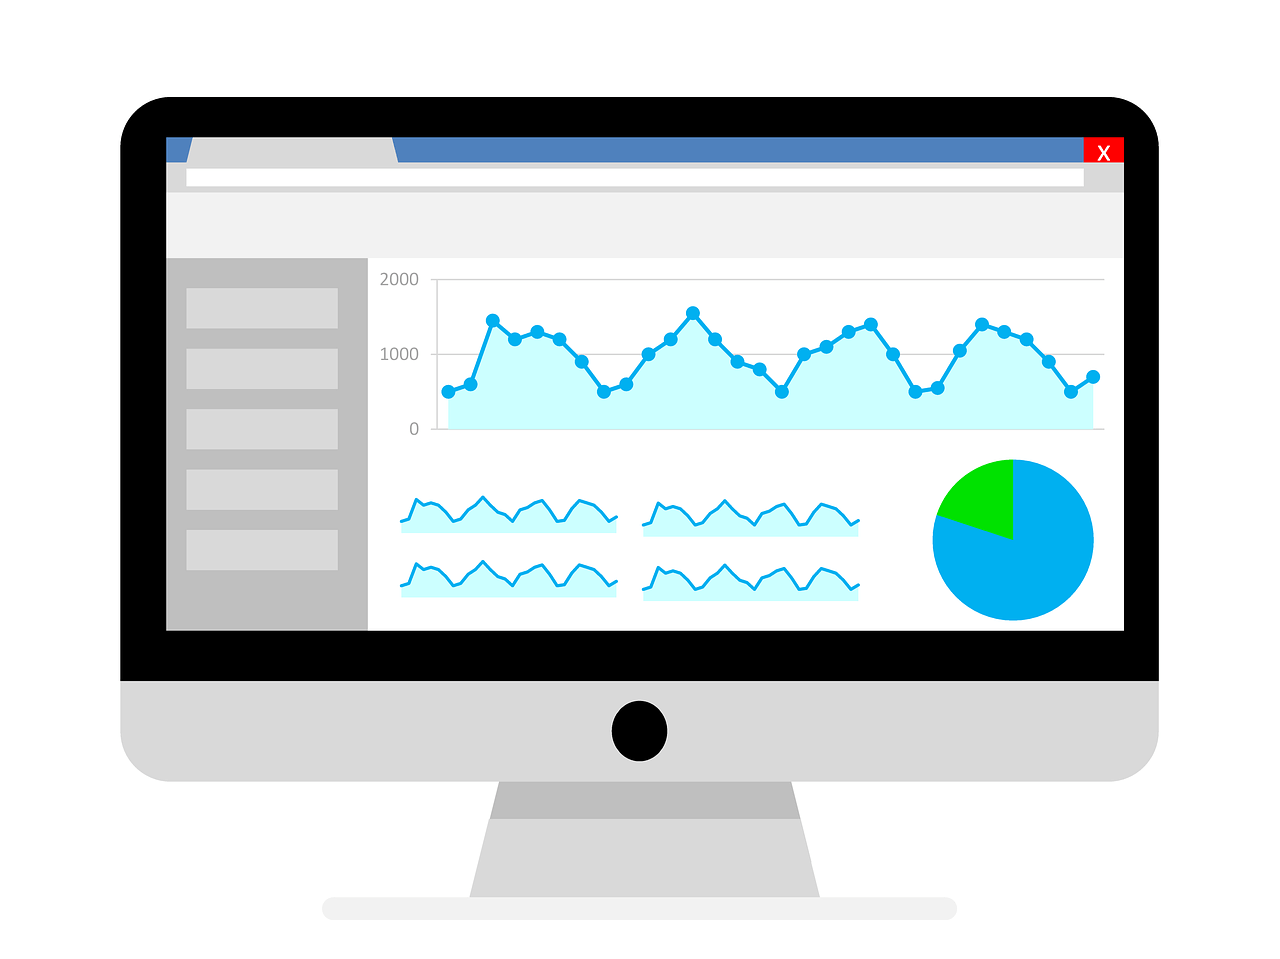
Google Analytics provides a wealth of information to guide your allocation of marketing resources. It has a very intuitive interface which allows you to customize your data view by time period and drill down on individual metrics for more detailed information.
Where’s your traffic coming from?
A very useful data set, found within the Acquisition menu, are the traffic sources. This information includes where on the web your visitors were just prior to visiting your site and how well optimized your site is for search.
Starting with the All Traffic sub-menu, select Channels. Note how many of your visitors came from Organic Search. Want to know which search engines specifically? You can find out within the Source/Medium menu, which (along with the Referrals sub-menu) show sites that sent traffic your way. Referring sites may include social platforms, association sites where you have a member profile, your email marketing software, websites that mention your business with a hyperlink — and other sites that may surprise you. These referral sources merit research to see if there are opportunities for collaboration.
Within the Social sub-menu (under Channels), you’ll see all social media platforms that referred traffic, including review sites like Yelp. Are the social networks where you’re spend time the ones sending traffic?
The Direct item within the Channels menu shows the number of visitors who accessed your site directly (by typing in your website url), providing you a sense of the effectiveness of your brand-building activities.
What are your website visitors doing on your site?
What information are your website visitors interested in, and what paths are they taking? The Behavior menu offers information on which pages your visitors are viewing, how long they’re spending, and where they go next. In the Site Content section (All Pages and Content Drilldown), any page that’s been viewed is listed, along with the number of pageviews, average visit duration and other page-specific data.
Of particular interest in the Behavior menu is the Behavior Flow, a visual graph showing entry pages and subsequent interactions, including the exit page.
Visitor demographics
The Audience menu offers various demographics information. Particularly useful is the geographical data. Starting with a world map, you can drill down to country, state and town to see exactly where your visitors are physically located. Use the location data for targeting networking activities, sponsorship opportunities and local marketing efforts. Following an event or geographically-targeted initiative, check your analytics for a bump in visits from the specific town where the event took place.
Want to know whether you’re attracting new visitors or returning ones? Data about whether visitors are first-timers or repeat visitors (returning) is included in the Behavior menu. The Technology section shows visitors’ browsers and operating systems, as well as the numbers of visitors accessing your site from desktop computers, tablets and mobile devices. Even a breakdown by type of mobile device (iPhone, Android, etc.) is provided. Utilize this valuable data to ensure that your website displays optimally for visitors.
Top line analytics takeaways
Within various menu items, Google Analytics provides data about bounce rate and visit duration, two key metrics.
Bounce rate is the percent of visitors who land on your site and leave within a few seconds, without exploring beyond the initial page. A lower bounce rate is better. Reduce your bounce rate by guiding website visitors to relevant and useful content (for example, Frequently Asked Questions, blog posts, educational videos and downloadable resources) that keeps them exploring your site.
Also explore the visit duration (average time on page data) for actionable insights. Perhaps multiple social sites send visitors to your site, but Twitter referrals spend twice as long as Facebook referrals. Food for thought: Maybe it’s appropriate to reallocate resources to Twitter. Drilling down in the All Pages data to an individual blog post, you may find that certain blog topics or formats generate much longer visit durations — valuable intelligence to help guide your activity going forward.
When trying to decide which of the myriad marketing tasks you should tackle, use your analytics to learn which efforts have been most effective. Whether you want to build brand awareness, drive traffic to your website, or increase visibility for your events, use your analytics to measure the effectiveness of different tactics, and spend more time on the ones that work best.
This post was published previously on this site and has been updated substantially to improve relevance and timeliness.