
Fess up: Do you review your social marketing analytics? While maintaining an active cadence on social media is important, monitoring your metrics is vital to inform your future activity. Digging into the data to assess the effectiveness of your social media marketing can be a challenge. Making sense of vague terms like Impressions, Reach and Views can be like trying to find your way through the fog.
We’re here to help.
Actions and reactions
Common goals for social marketing are to build awareness, credibility and engagement. Your website analytics show visits driven from other sources, including specific social platforms. Since the ideal marketing channels vary based on your industry, niche and demographic, identifying the optimal channels (social and otherwise) is an important step. Use the website analytics data to identify your most effective marketing channels.
It’s also essential to review the analytics or insights for each of your active social platforms. In this post, we discuss specific metrics for individual organic (non-promoted) posts. Note that data for sponsored posts (also known as promoted posts or paid advertising) may appear separately.
Identifying the haves and have-nots — the posts with social interactions and those without — is pretty straightforward. Next we define the most common social interactions, starting with the least potent.
- Likes — Oh, the lazy like. Today’s social users often “like” without actually reading a post. Viewers scrolling through an endless news feed may quickly click like to simply acknowledge a post of interest.
- Reactions (including those sad, angry or puzzled faces on Facebook, or clapping hands and lightbulbs on LinkedIn) are a tiny step up in the engagement food chain. Selection of a specific reaction icon may indicate that the reader scanned the post and is expressing an appropriate response.
- Clicks on a link, a video play button or image — are more purposeful actions. Clicks indicates that the viewer had sufficient interest to compel action, and demonstrate greater engagement than reactions.
- Shares (or retweets) — Subsequent to clicking a link, image or other post attachment, a user may engage a bit further, selecting the option to share or retweet the content. Sharing implies some affirmation of a post and is a further nudge up the engagement food chain.
- Comments, like shares, demonstrate a more intentional level of engagement. A meaningful comment requires more than a cursory scan of the post content.
- Conversions — Taking the next step subsequent to a click — such as a webinar registration, newsletter signup or contact form submission — indicates that a user is progressing along your leads funnel.
Into the fog … reach, impressions and views
To inform your marketing activity, your next task is to assess which posts are most successful. Nearly every client asks about reach, impressions, views and engagement.
- Reach
- Facebook: Post reach is the number of people who saw your post (in their news feed or by visiting your page) at least once during a specific time period. Only unique users are counted (so if the same user views a post multiple times, he is counted only once).
- Views
- LinkedIn: Views of a personal post (or status update) on LinkedIn are defined similarly to Reach for a post on Facebook — the number of people who viewed your post in their feed.
- Impressions
- Facebook: Impressions are the number of times a post entered a user’s screen. If a user views your content more than once, an impression is tallied for each time the same user viewed your content. On Facebook, post impressions are always equal to or greater than reach.
- LinkedIn: Impressions on LinkedIn are the number of users who viewed a post (or status update) by a Page. (This stat is akin to the views for a post by a person on LinkedIn)
- Engagement
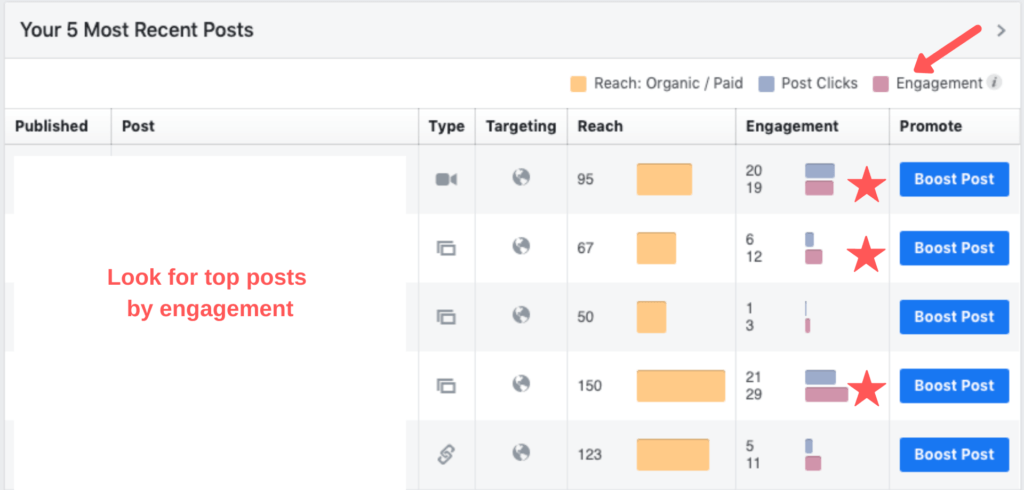
- Facebook engagement is a sum of likes, comments, shares and clicks. As shown in the graphic below, engagement stats are shown in Insights.
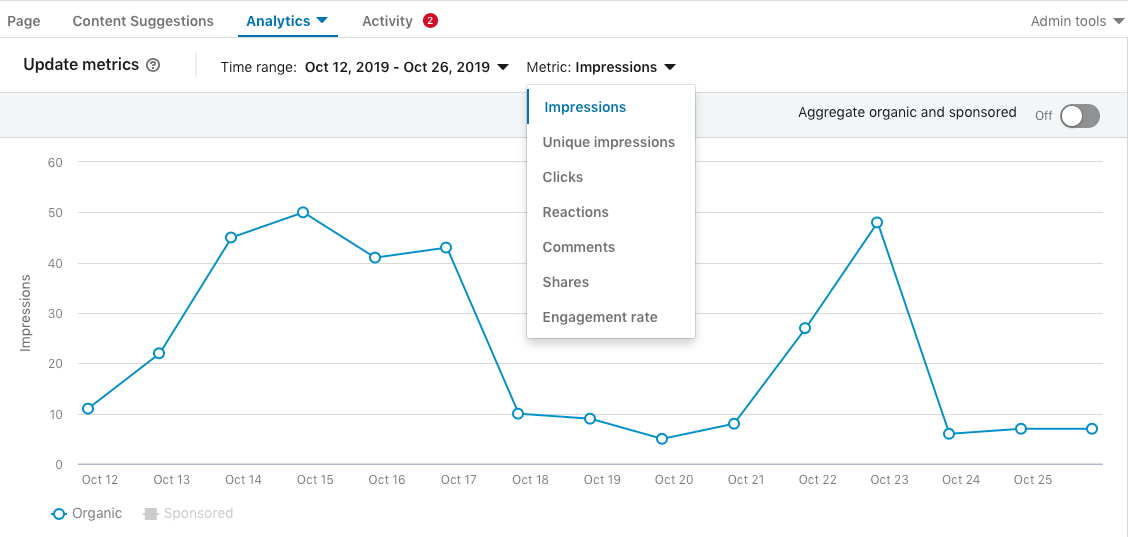
- LinkedIn analytics (including engagement rate) for a business page are accessed from the Analytics menu on the top of your Page profile. Select Updates from the drop-down menu and choose display options including impressions, clicks, reactions, comments and shares.
- Metrics for a personal LinkedIn profile are rather basic. Access the data from the Home page by clicking Views of your post in the left nav; then scroll to view stats for individual posts.
Finding clarity: Where to find the data
Facebook analytics are best viewed in Insights. Scroll beneath the Page Summary graphs to the table showing your most recent posts.
LinkedIn analytics for a business page are accessed from the Analytics menu on the top of your Page profile. Select Updates from the drop-down menu and choose display options including impressions, clicks, reactions, comments and shares.
The fog lifts
Armed with an understanding of the analytics terminology and where to find your marketing data, the fog lifts and you are better able to assess the effectiveness of your social content.
If you need guidance developing your social marketing strategy or want a seasoned hand to maintain your marketing, we’re happy to help. Give us a call and let’s talk about your needs.